Develop
Prometheus
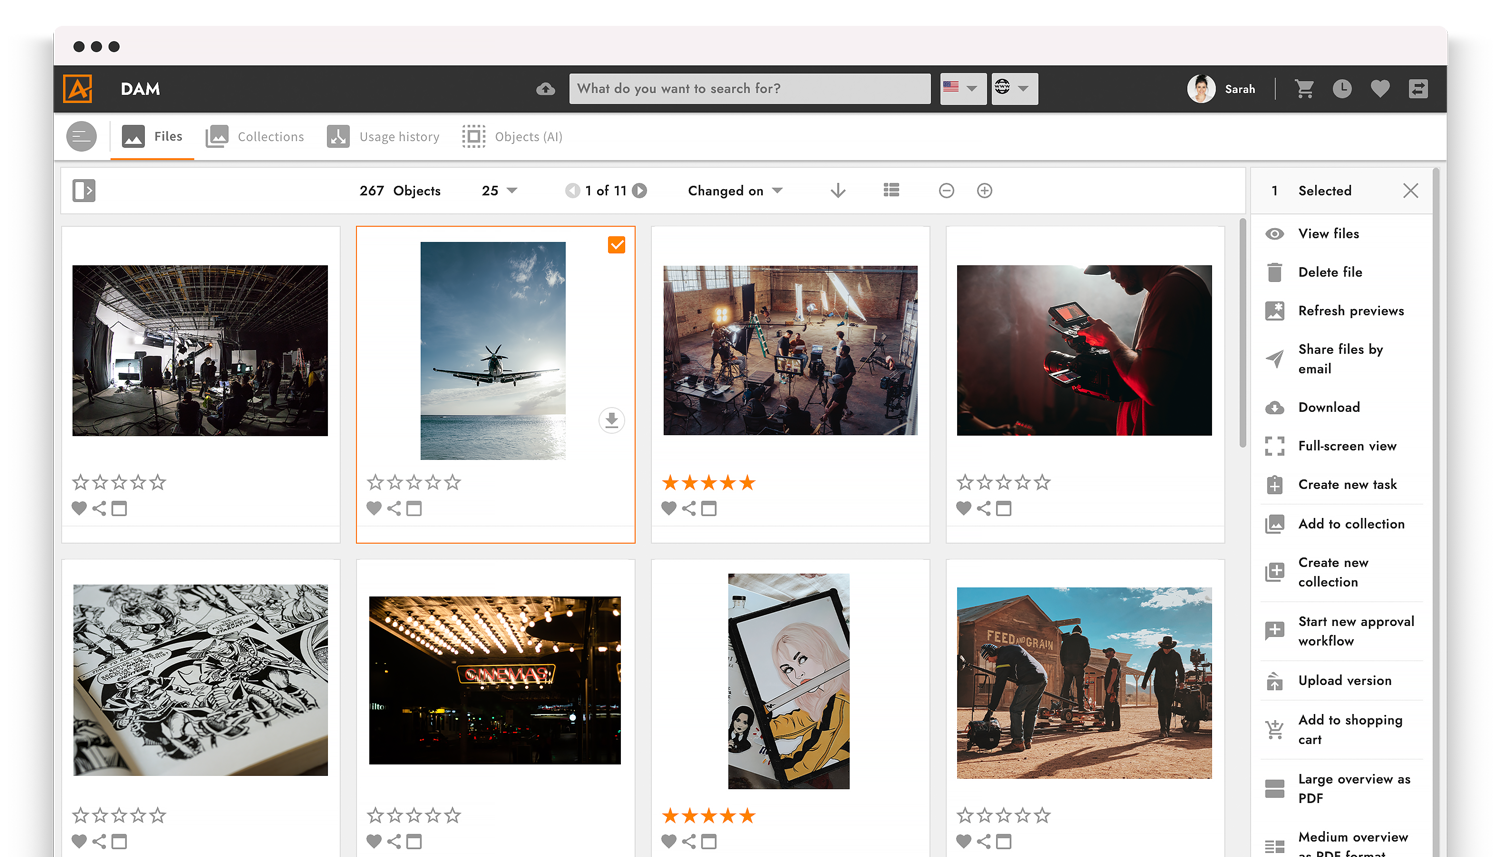
Many organizations use the open-source system Prometheus to monitor their systems. This is especially true in cloud-native environments. Very often, administrators also use the Grafana tool to visualize stored metrics and to create dashboards. Real-time alarms are also frequently implemented with Prometheus.
You also use Prometheus to monitor your system landscape and would like to include your digital asset management in the monitoring process? Then the 4ALLPORTAL DAM Prometheus connector is the right solution for you. The interface transfers all metrics required for monitoring and alerting purposes from the digital asset management software to Prometheus.
Monitoring metrics from digital asset management – with the Prometheus connector
The Prometheus connector for digital asset management enables you to transfer statistics directly to your Prometheus server via 4ALLPORTAL. These could include the following aspects:
- A counter for existing files
- A counter for deleted files
- CPU utilization
- RAM utilization
The Prometheus DAM interface is part of the 4ALLPORTAL Core Engine. This means that no additional licensing is needed. All you need to do is provide the technical requirements (connection to an existing Prometheus server).
Benefits
- Monitor DAM software centrally
- Real-time alarms for critical states in the DAM system
- Continue to use existing monitoring system and easily integrate DAM
- Integrate digital asset management into your monitoring system based on Prometheus and Grafana
- No additional stand-alone solutions required for monitoring
Click through the product tour yourself now or request price directly